Predictive Agility in Legacy Plants: Turning Old Machines into Smart Assets
The key to competing with smart factories isn’t replacing your legacy equipment; it’s making your existing data actionable in real-time.
- Reactive maintenance is a significant drain, costing far more in downtime and lost opportunity than the investment in predictive technologies.
- Non-invasive sensors and tiered data processing (Edge/Cloud) can modernize old machines without requiring massive capital or operational disruption.
Recommendation: Shift from a machine-first (fix when broken) to a data-first mindset by retrofitting sensors and unifying data streams to anticipate failures before they halt production.
For a plant manager running a facility with 20-year-old equipment, the rise of fully automated “smart factories” can feel like an insurmountable threat. The conventional wisdom suggests a massive, capital-intensive overhaul is the only way to compete. This often leads to a state of paralysis, where operations continue in a reactive mode—fixing machines only after they fail. This traditional “preventive” maintenance, based on scheduled servicing, is better than nothing, but it still fails to catch the majority of issues that lead to catastrophic downtime. The common belief is that true predictive capability is a luxury reserved for new, state-of-the-art machinery.
But what if this core assumption is wrong? What if the path to competitive agility isn’t about replacing your entire production line, but about making your old data *speak the language of now*? The real challenge isn’t the age of your equipment, but the latency and isolation of the information it produces. Achieving predictive data agility in a legacy environment is a strategic shift. It’s about intelligently retrofitting existing assets, processing data where it’s most effective, and empowering your operators to become the first line of defense against inefficiency. This isn’t just about preventing failures; it’s about transforming raw, noisy signals from old machines into the rapid, precise decisions that define a modern manufacturing powerhouse.
text
This article provides a practical roadmap for this transformation. We will explore the true cost of inaction, detail how to gather data from legacy equipment, and outline the architecture needed to process it effectively. The following sections break down the key steps to building data agility from the ground up.
Summary: Predictive Agility in Legacy Plants
- Why Waiting for Machine Failure Costs 4x More Than Predictive Sensors?
- How to Retrofit Sensors on 20-Year-Old Equipment Without Downtime?
- Edge Computing or Cloud: Which Processes Real-Time Alerts Faster?
- The Data Silo Error That Causes 30% of Production Bottlenecks
- When to Train Operators on Data Dashboards to Reduce Waste?
- When to Choose Low-Code Robotics Platforms for In-House Tweaking?
- The Calculation Mistake That Underestimates Emissions by 20%
- How to Integrate Robotics Automation Without Disrupting Production Flow?
Why Waiting for Machine Failure Costs 4x More Than Predictive Sensors?
The “if it ain’t broke, don’t fix it” mantra is one of the most expensive philosophies in modern manufacturing. Reactive maintenance, the practice of waiting for a machine to fail before repairing it, creates costs that ripple far beyond a single replacement part. The most visible expense is downtime. Research reveals that unplanned equipment failures cost organizations an average of $260,000 per hour. This staggering figure doesn’t even account for the hidden costs: expedited shipping fees for emergency parts, contractual penalties for late deliveries, and the long-term erosion of customer trust.
In contrast, predictive maintenance is an investment in foresight. By using sensors to monitor equipment health in real-time, you shift from reacting to a crisis to proactively addressing a developing issue. The return on this investment is significant and multifaceted. A large chemical manufacturer, for instance, implemented predictive capabilities on its extruders and achieved an 80% reduction in unplanned downtime, saving around $300,000 per asset. This is not an isolated case. The core value lies in catching problems at their inception, allowing for scheduled, low-cost interventions instead of emergency, high-cost overhauls.
The financial argument extends to quality and talent. A machine doesn’t just fail catastrophically; its performance degrades first, leading to micro-defects, increased material scrap, and energy consumption spikes. Predictive sensors catch this degradation. Furthermore, the high-stress environment of reactive maintenance leads to higher employee turnover. The cost of replacing and training a skilled technician can be substantial, adding another layer to the financial burden of waiting for failure. Predictive systems create a more stable, planned, and less stressful work environment, which is a critical, often-overlooked, financial benefit.
How to Retrofit Sensors on 20-Year-Old Equipment Without Downtime?
One of the biggest misconceptions about IIoT is that it requires brand-new, “smart-ready” machinery. The reality is that a vast majority of legacy equipment can be brought into the digital age through non-invasive retrofitting. This process involves adding external sensors to monitor key performance indicators—like vibration, temperature, and current draw—without needing to halt production, drill into casings, or perform complex electrical work. The goal is to capture the machine’s “vital signs” with minimal disruption.
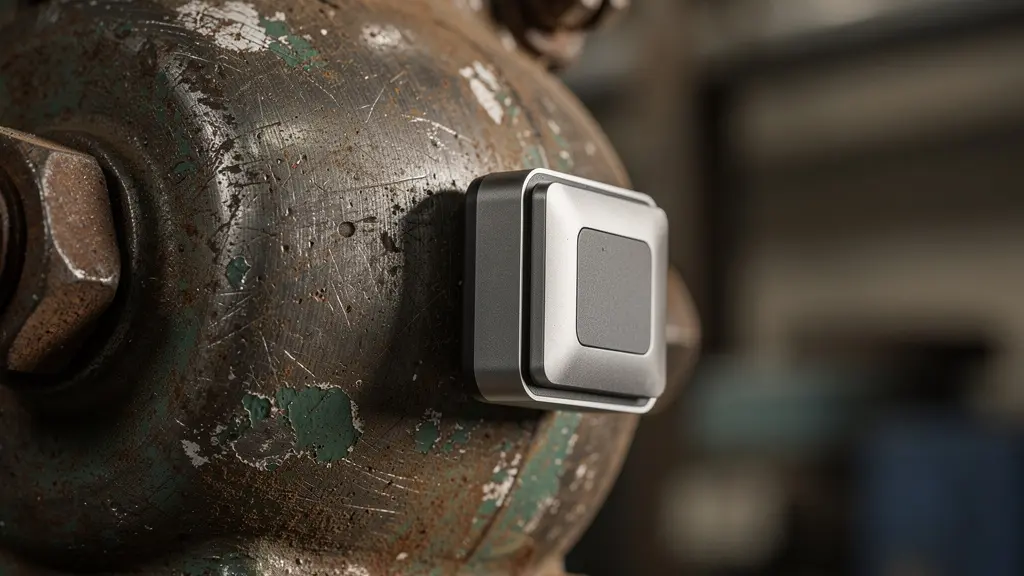
The key is selecting the right sensor for the right asset. Not all equipment is created equal, and a tiered approach ensures cost-effectiveness. As the image above illustrates, a modern wireless sensor can be attached to a weathered, older motor in seconds. For your most critical assets—those whose failure would shut down the entire line—real-time monitoring with clamp-on current transformers provides instantaneous data. For important but less critical assets, magnetic-mount accelerometers can be attached to the housing to detect subtle changes in vibration that signal bearing wear or misalignment. For non-essential equipment, even periodic thermal imaging can reveal overheating components before they fail.
This strategy allows for a phased, budget-friendly rollout. You can start with your most problematic or critical machines, prove the ROI with tangible results, and then expand the program across the plant floor. The focus is on ease of installation and immediate data generation, turning your oldest and most reliable workhorses into data-rich assets.
The following table provides a clear framework for selecting non-invasive sensors based on equipment criticality, ensuring you apply the right level of monitoring where it matters most.
| Equipment Tier | Sensor Type | Installation Method | Data Frequency |
|---|---|---|---|
| Critical Assets | Clamp-on current transformers | External mounting, no downtime | Real-time (1-second intervals) |
| Important Assets | Magnetic-mount accelerometers | Magnetic attachment to housing | High-frequency (100Hz+) |
| Non-Essential | Thermal cameras | Remote mounting, no contact | Periodic snapshots (hourly) |
Edge Computing or Cloud: Which Processes Real-Time Alerts Faster?
Once you have sensors streaming data from your legacy equipment, the next critical question is: where should that data be processed? Sending everything directly to the cloud is a common but often inefficient approach. It introduces latency and can lead to exorbitant data storage costs. For a manufacturing environment where milliseconds matter, a tiered processing architecture involving both Edge and Cloud computing provides a far more agile and cost-effective solution. This isn’t an “either/or” choice; it’s about using each for what it does best.
Edge computing refers to processing data directly on or near the machine where it is generated. Its primary advantage is speed. For critical safety interlocks, like detecting a pressure spike that requires an immediate shutdown, the sub-second response time of an edge device is non-negotiable. It acts as the machine’s local reflex system. This local preprocessing also drastically reduces data transmission volume. By filtering out noise and sending only relevant anomalies or summaries to the cloud, preprocessing data at the Edge can reduce cloud data ingestion and storage costs by up to 90%.
The Cloud, on the other hand, excels at large-scale analysis and long-term storage. It’s the ideal place for tasks that are not time-sensitive but require immense computational power. This includes retraining machine learning models with historical data from across the entire fleet of assets, performing deep-dive historical analysis to identify long-term trends, and generating weekly or monthly performance reports for management. Some architectures also include a “Fog” layer, which is an intermediate level of computing at the plant or line level, ideal for coordinating and optimizing multiple machines with a response time of a few seconds.
The Data Silo Error That Causes 30% of Production Bottlenecks
Installing sensors and processing their data is only half the battle. A vibration alert from a motor is just noise until it’s given context. Does the alert coincide with a specific batch of raw material? Is the machine scheduled for a product changeover? This is where data silos—the separation of operational technology (OT) data from information technology (IT) data—become a major roadblock. A study from Deloitte highlights that poor maintenance strategies can reduce a plant’s overall productive capacity between 5-20%, a problem massively exacerbated by siloed information.
The most effective predictive systems break down these walls. The solution lies in creating a Unified Namespace (UNS), a central data hub where information from all sources—sensors (OT), Manufacturing Execution Systems (MES), and Enterprise Resource Planning (ERP) systems (IT)—can coexist and be correlated. When a sensor’s vibration data is combined with the production schedule from the MES and the maintenance history from the ERP, an alert transforms from a simple warning into an actionable insight. You can distinguish a genuine problem from a normal vibration pattern associated with a specific production run.
This “operational contextualization” is what separates basic monitoring from true predictive agility. It allows you to prioritize alerts intelligently and prevent costly false alarms or unnecessary shutdowns, which themselves can cause significant production bottlenecks.
Case Study: Context Integration Prevents Costly Production Interruption
A global manufacturer implemented a Unified Namespace connecting its IoT sensors with Azure IoT Hub and existing ERP data. By being able to correlate vibration alerts from a critical machine with its upcoming production schedule, the team could differentiate between normal operational stress and a genuine sign of impending failure. This ability to add context prevented an estimated 65% of potential critical failures before they occurred, leading to a 25% reduction in overall maintenance costs and improving total machine uptime by 30%.
When to Train Operators on Data Dashboards to Reduce Waste?
The most advanced predictive analytics system is useless if the people on the plant floor don’t trust it, understand it, or know how to act on its insights. Empowering operators is the final, and perhaps most critical, step in closing the loop between data and action. However, rolling out complex dashboards and expecting immediate adoption is a recipe for failure. Training must be timely, targeted, and tied directly to the operator’s daily tasks and incentives. The human element is often the biggest hurdle; a recent report found that 45% of maintenance leaders cite staffing constraints and a lack of skilled workers as a primary obstacle to implementing modern strategies.
Effective training begins *before* the system is fully deployed. Start by introducing a single, simple Key Performance Indicator (KPI)—such as the energy consumption of a specific machine—one week before the full dashboard launch. This acclimates the team to data-driven monitoring without overwhelming them. On the day of the launch, the dashboard must include an input mechanism. This allows operators to log context (“machine is vibrating more during the startup cycle,” “this batch of material seems to be causing issues”), turning them into active participants in the data collection process, not just passive observers.
To drive adoption and a culture of continuous improvement, introduce friendly competition. Launching team leaderboards that track metrics like waste reduction or uptime, tied to transparent performance bonuses, can galvanize the workforce. This “human-in-the-loop” analytics approach fosters ownership and accountability. Finally, the process must be iterative. Collect feedback from the operators after the first month and be prepared to simplify the dashboard, removing unused metrics and highlighting the data they find most valuable. The goal is not a data-heavy dashboard, but an action-oriented one.
When to Choose Low-Code Robotics Platforms for In-House Tweaking?
As a legacy plant becomes more data-agile, the next frontier is flexible automation. Traditional industrial robots are powerful but rigid; they require specialized programmers and significant downtime for any reprogramming. This model doesn’t fit the dynamic needs of a modernizing plant. This is where low-code collaborative robots, or “cobots,” offer a compelling alternative. These platforms are designed to be programmed and re-tasked by in-house process engineers and even trained operators, using intuitive, graphical interfaces rather than complex code.

The decision to opt for a low-code robotics platform hinges on one key factor: process variability. If your plant deals with seasonal product variations, frequent small-batch runs, or evolving packaging requirements, low-code cobots are the ideal solution. They provide the automation needed to improve consistency and throughput, but with the flexibility to be re-deployed in hours, not weeks. This allows your automation strategy to match the speed of your production changeovers, a critical capability for staying competitive.
This approach democratizes automation. Instead of being a locked-in, high-cost project, it becomes a flexible tool in the hands of the people who know the process best. It fosters a culture of continuous improvement, where your own team can identify bottlenecks and deploy a robotic solution without relying on external integrators.
Case Study: Low-Code Robotics Achieving ROI in Under 3 Months
A consumer goods manufacturer struggled with the manual labor costs and inconsistencies of re-packaging products for seasonal promotions. By deploying low-code collaborative robots on mobile carts, their process engineers were able to re-task the robots for new packaging configurations in under two hours. The flexibility eliminated the need for temporary labor and drastically reduced changeover time, resulting in tens of millions in downtime savings and a full return on investment (ROI) in less than three months.
The Calculation Mistake That Underestimates Emissions by 20%
Many manufacturing plants calculate their energy consumption and carbon emissions based on static, “nameplate” values—the theoretical efficiency rating provided by the equipment manufacturer. This common practice leads to a significant and costly error. In reality, a machine’s energy draw is not constant. It peaks during startup, fluctuates with load, and increases as components degrade and become less efficient. Relying on nameplate data ignores these real-world dynamics, and as a result, emissions can be severely miscalculated.
The same sensor data used for predictive maintenance can correct this error and provide a far more accurate picture of your plant’s environmental footprint. Real-time current sensors reveal the true energy consumption patterns of each machine. Studies have shown that this real-world data often exposes a significant gap, with some analyses showing that nameplate energy consumption ignores massive peaks and can lead to an underestimation of actual emissions by 20% or more. This isn’t just a compliance issue; it’s a financial one. Inaccurate data means missed opportunities to reduce energy costs and potential liabilities as carbon-tracking regulations become stricter.
By linking energy spikes to specific production activities or equipment degradation patterns, you can pinpoint the root causes of inefficiency. An aging motor that draws 15% more current to perform the same task is not only a maintenance risk but also a hidden source of excess emissions and cost. Making this connection transforms your maintenance program into a powerful tool for sustainability and cost reduction.
Action Plan: Correcting Your Emission Calculation
- Replace Static Values: Immediately begin replacing theoretical nameplate energy values in your reports with data from real-time current sensors attached to your critical equipment.
- Track Material Waste: Inventory the carbon footprint associated with material scrap. Use vision systems or weigh scales at key process points to get an accurate measure of waste.
- Correlate Energy and Health: Actively link energy consumption spikes to equipment health data from vibration or thermal sensors to create predictive alerts for inefficiency.
- Analyze Inefficient Operation: Identify patterns of inefficient operation (e.g., excessive idle time, non-optimal speed) that contribute to energy waste and address them through operator training or process adjustments.
- Integrate into a Plan: Incorporate these accurate, real-time metrics into your overall continuous improvement plan and set concrete targets for energy and emission reduction.
Key Takeaways
- Predictive agility in legacy plants is achieved by making existing data actionable, not by replacing machinery.
- A tiered approach to retrofitting sensors and processing data (Edge/Cloud) offers a cost-effective path to modernization.
- Breaking down data silos between OT and IT is essential for transforming raw sensor alerts into context-rich, actionable insights.
How to Integrate Robotics Automation Without Disrupting Production Flow?
The final hurdle in advanced automation is deployment. Integrating a new robotic cell into an existing, finely-tuned production line is a high-stakes operation. A miscalculation can lead to weeks of disruption, creating bottlenecks that negate any potential efficiency gains. The traditional method of physical trial-and-error—installing the robot and then painstakingly tweaking its position and programming on the live factory floor—is slow, risky, and expensive. This is where Digital Twin simulation provides a revolutionary, disruption-free alternative.
A digital twin is a virtual model of your physical production line. Before a single piece of hardware is ordered, you can use this simulation to test the entire integration. You can import the 3D model of the robot, place it in the virtual cell, and run thousands of cycles to check for reach, potential collisions, and optimal workflow. This allows you to identify and solve 90% of integration problems in a virtual environment, without ever disrupting the actual flow of production. As Brandon Haight, General Manager at Toyota North America, noted about their use of predictive tools in a BizTech Magazine article, the goal is to “use predictive solutions to change our maintenance work from reactive to truly proactive.” This same proactive philosophy applies perfectly to integration.
This approach dramatically de-risks and accelerates automation projects. As the comparative data below shows, identifying problems and testing solutions in a digital twin can reduce project timelines from months to weeks, with corresponding cost savings. It transforms integration from a high-risk gamble into a well-rehearsed, predictable deployment.
The following table, based on industry data, highlights the stark contrast in timelines and costs between traditional physical integration and a Digital Twin-first approach.
| Integration Phase | Digital Twin Timeline | Physical Integration Timeline | Cost Impact |
|---|---|---|---|
| Problem Identification | 2-3 days | 2-3 weeks | 90% cost reduction |
| Solution Testing | 1 week | 4-6 weeks | 75% cost reduction |
| Final Deployment | 3-5 days | 2-3 weeks | 60% cost reduction |
Maximo allows a skilled team member to see the health of the equipment and its components, monitor for any abnormal activities and use predictive solutions to change our maintenance work from reactive to truly proactive.
– Brandon Haight, General Manager at Toyota North America
To fully implement these strategies, the next logical step is to conduct an audit of your most critical assets to identify the best candidates for a pilot retrofitting project. Begin by applying this data-first mindset to transform your legacy plant into a truly agile competitor.